
Why construction sites struggle with accurate truck load volume
Jump to Section:
Sign up for updates

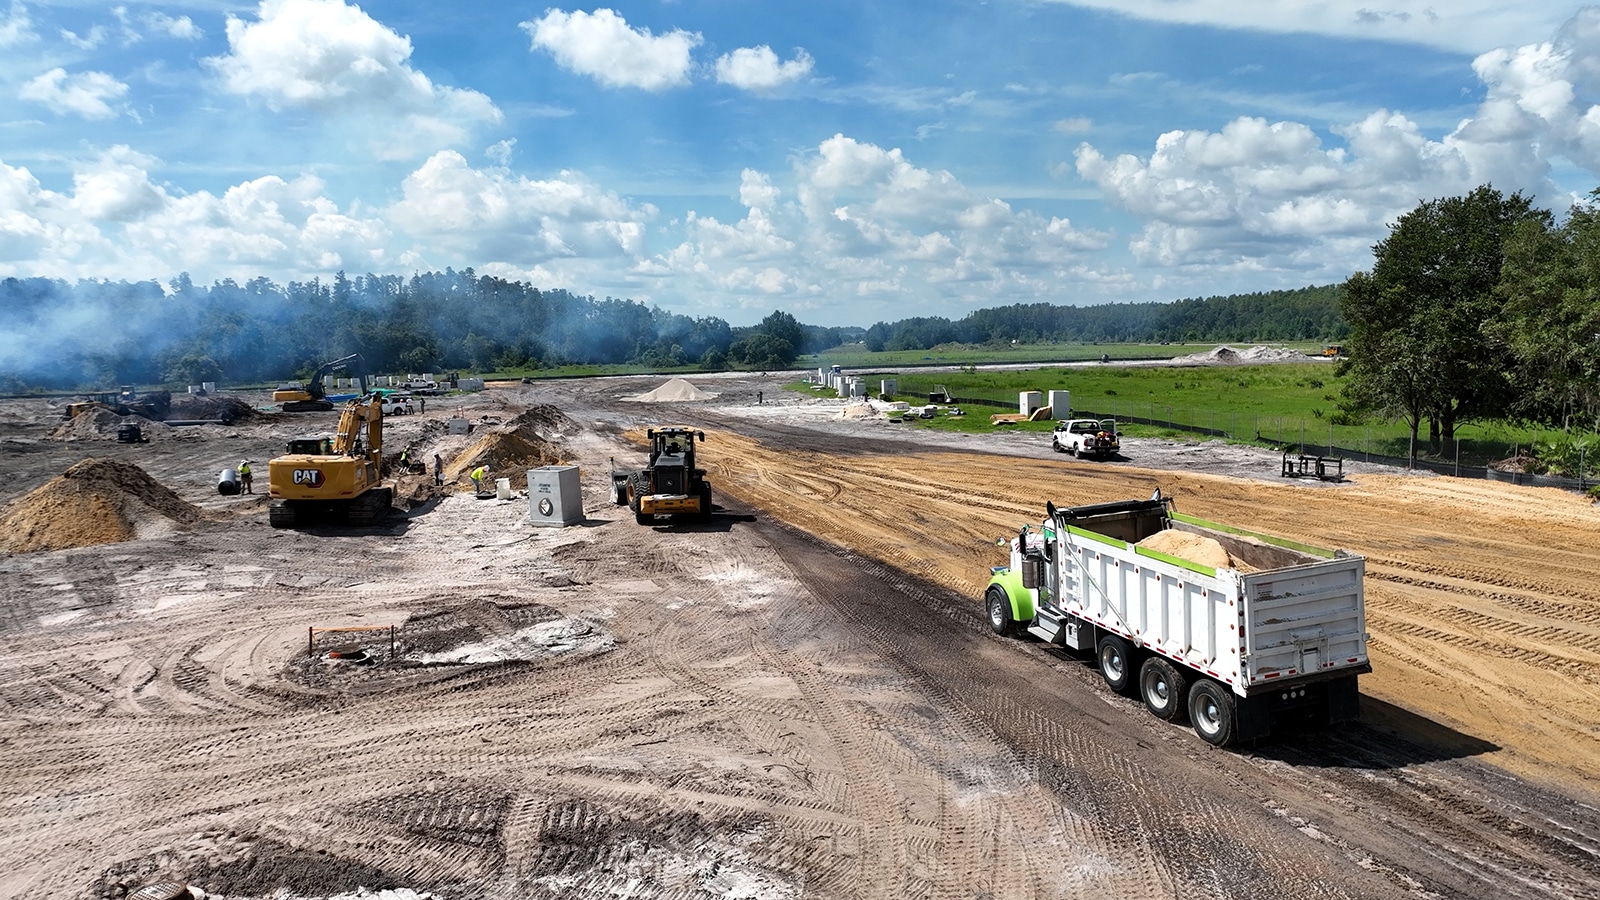
In modern civil construction, project managers track budgets, schedule works, and bid tenders down to the exact dollar. Yet, when it comes to the raw materials driving these projects – dirt, sand, gravel, and spoil – many sites still rely on measurement methods that belong in the last century.
In Summary
Traditional weight-based scales and manual estimation methods cause major financial leaks on construction sites due to unpredictable “water weight”, material compaction, and undetected bin carryback. We demonstrate how transitioning to Loadscan’s elevated 2D LiDAR scanning technology eliminates billing disputes and saves contractors up to $250,000 per scanner by replacing guesswork with trade-certified ±1% in-motion volume accuracy.
While a manufacturing plant measures its output to the millimeter, earthmoving projects often rely on visual “eyeballing,” manual bucket counts, or weighbridge-to-volume mathematical conversions to track millions of cubic meters of material.
Our experience is that this mismatch between how materials are budgeted (volume) and how they are tracked (weight or estimates) introduces potentially severe financial losses, project delays, and billing disputes.
Let’s analyze the core reasons why construction sites struggle with accurate truck load volume measurement, and how our modern volumetric scanning is rewriting the rules of civil earthworks.
The weight-to-volume conversion dilemma is a moisture trap
Most construction materials are bought and sold by weight to comply with road transport laws, but civil engineering designs and excavation plans are drafted in cubic volume (m3 or yd3). Converting weight to volume requires a standard bulk density conversion factor which, in reality is anything but standard, and we get that.
- The moisture problem: Materials like soil, sand, and clay act as physical sponges. When it rains, the water absorbed by the product adds considerable weight to the load without changing its physical, spatial volume. If a site pays subcontractors or suppliers by weight, they are routinely paying a premium for “water weight” in addition to the actual product being delivered.
- The Fulton Hogan proof: During a major landfill rehabilitation capping program in Melbourne, civil contractor Fulton Hogan initially calculated truck payloads at 21 cubic meters, based on weight. After installing a Loadscan Load Volume Scanner (LVS), they discovered the true material volume of the product was actually only 17 cubic meters per load. The remaining weight was purely water, meaning they were overpaying for four non-existent cubic meters of material per truck before switching to volumetric scanning.
This is the moisture trap – water is incredibly heavy, but it doesn’t take up any extra physical space when absorbed. If you calculate the volume based on how much the truck weighs, you will get a falsely inflated number. You are paying a premium to buy and haul heavy “water weight” instead of actual, usable product.
Dynamic bulking and compaction are constant struggles for construction sites
Soil and aggregate never behave consistently; their density and volume expand and contract depending on how they are handled. A single cubic meter of soil in the ground does not stay a cubic meter when you dig it up, nor does it stay a cubic meter when you pack it down.
The bulking factor: Undisturbed material in a “banked” borrow pit expands (bulks or fluffs) as air enters the spaces between particles once it is excavated and loaded loose into a truck bed.
The compaction factor: When the truck dumps that loose soil at the construction site, and heavy rollers pack it down to build a road or foundation, the air is squeezed back out. This causes the material to shrink

These factors are “dynamic” because they change constantly depending on the material type, moisture levels, and how tightly the loader packs the bucket. If a quarry or civil site relies on generic, static textbook charts to guess these numbers, they will constantly miss the mark. In fact, even survey estimates fail as they rely on advanced drone surveys and digital terrain mapping which only capture “in-place” volumes; they cannot accurately account for compaction and bulking variations while material is actively in transit. For instance, on a 29,000 m2 landslide clearance project, the Hawkesbury City Council discovered drone-generated estimates differed significantly from truck-haul realities for this exact reason, requiring Loadscan LVS data to establish the true, loose volume moved.
Irregular load shapes and inconsistent loading
Unlike manufactured goods, loose bulk materials form irregular, uneven piles inside a truck tray. They create peaks, valleys, and asymmetric slopes that shift during transit, and are dramatically affected by operators. Loader and excavator operators load bins differently depending on their speed, experience, and shifts. For example, in the Coops Case Study, we found that in the $200 million Pimpama Home Focus Centre earthworks project, the contractor (Coops) struggled with manual bucket-calibration estimates. Operator changes meant different capacities were loaded into the buckets, creating massive payload uncertainty.
Inconsistent loading practices also raise the risk of off-center and overloaded trucks. When materials are loaded unevenly in atruck, it creates asymmetric weight distribution. This puts uneven stress on the truck’s chassis, accelerates tire wear, voids tire warranties, and increases rollover risks.
Traditional scales cannot detect these physical load contours, but 3D LiDAR profiling immediately flags uneven loads so managers can train their loader operators to better hit their nominal loading “sweet spot”.
The hidden tax of “carryback”
After a truck dumps its payload at the tipping pad, wet or sticky clay and soil often adhere to the base and corners of the truck bin. This residual material is known as carryback (or haul-back).
This is why carryback acts like a massive “hidden tax” on your operating budget:
Paying for “ghost” dirt: If you use traditional weight scales or count trucks manually, you have no easy way of knowing how much material stayed stuck in the bin. When the truck goes back to get loaded again, you weigh or count that same stuck mud a second time. You end up paying subcontractors to haul the exact same pile of dirt back and forth all day.
Shrinking fleet capacity: If 20% of a truck bed is blocked by stuck mud, that truck’s carrying capacity is cut by 20%. To move the same total amount of material, your fleet could have to make thousands of extra, unnecessary trips.
Burning cash and fuel: Driving with heavy “dead weight” forces the engine to work harder, which burns extra diesel, wears out tires faster, and increases CO2 emissions.
The real-world cost was easily seen at Rodney Aggregates in New Zealand, where contractors were stripping sticky, wet overburden. By installing a Loadscan LVS to scan empty returning trucks, they discovered that vehicles were carrying up to 5 cubic meters of carryback per load, representing 20% to 25% of the truck’s total capacity.
The weighbridge bottleneck and manual inefficiencies
To get accurate weights, trucks must stop and settle on static scales which can, on average, waste up to 30 seconds per cycle. On high-frequency civil sites moving hundreds of loads a day, this bottleneck can easily cost a site 1 to 2 lost loads per shift per truck.
Furthermore, relying on manual, paper-based docket systems (tallymen, ticket writers, and hand-written logs) is slow, labor-intensive, and highly vulnerable to human error and lost tickets. Tauranga-based New Zealand company, Taylor Bros Transport, previously filled out up to 150 hand-written paper dockets a day. By switching to automated RFID truck scanning, they eliminated anunnecessary paper trail, allowing drivers to scan and print tickets automatically in under 30 seconds.
The volumetric solution to accurate truck load measurements
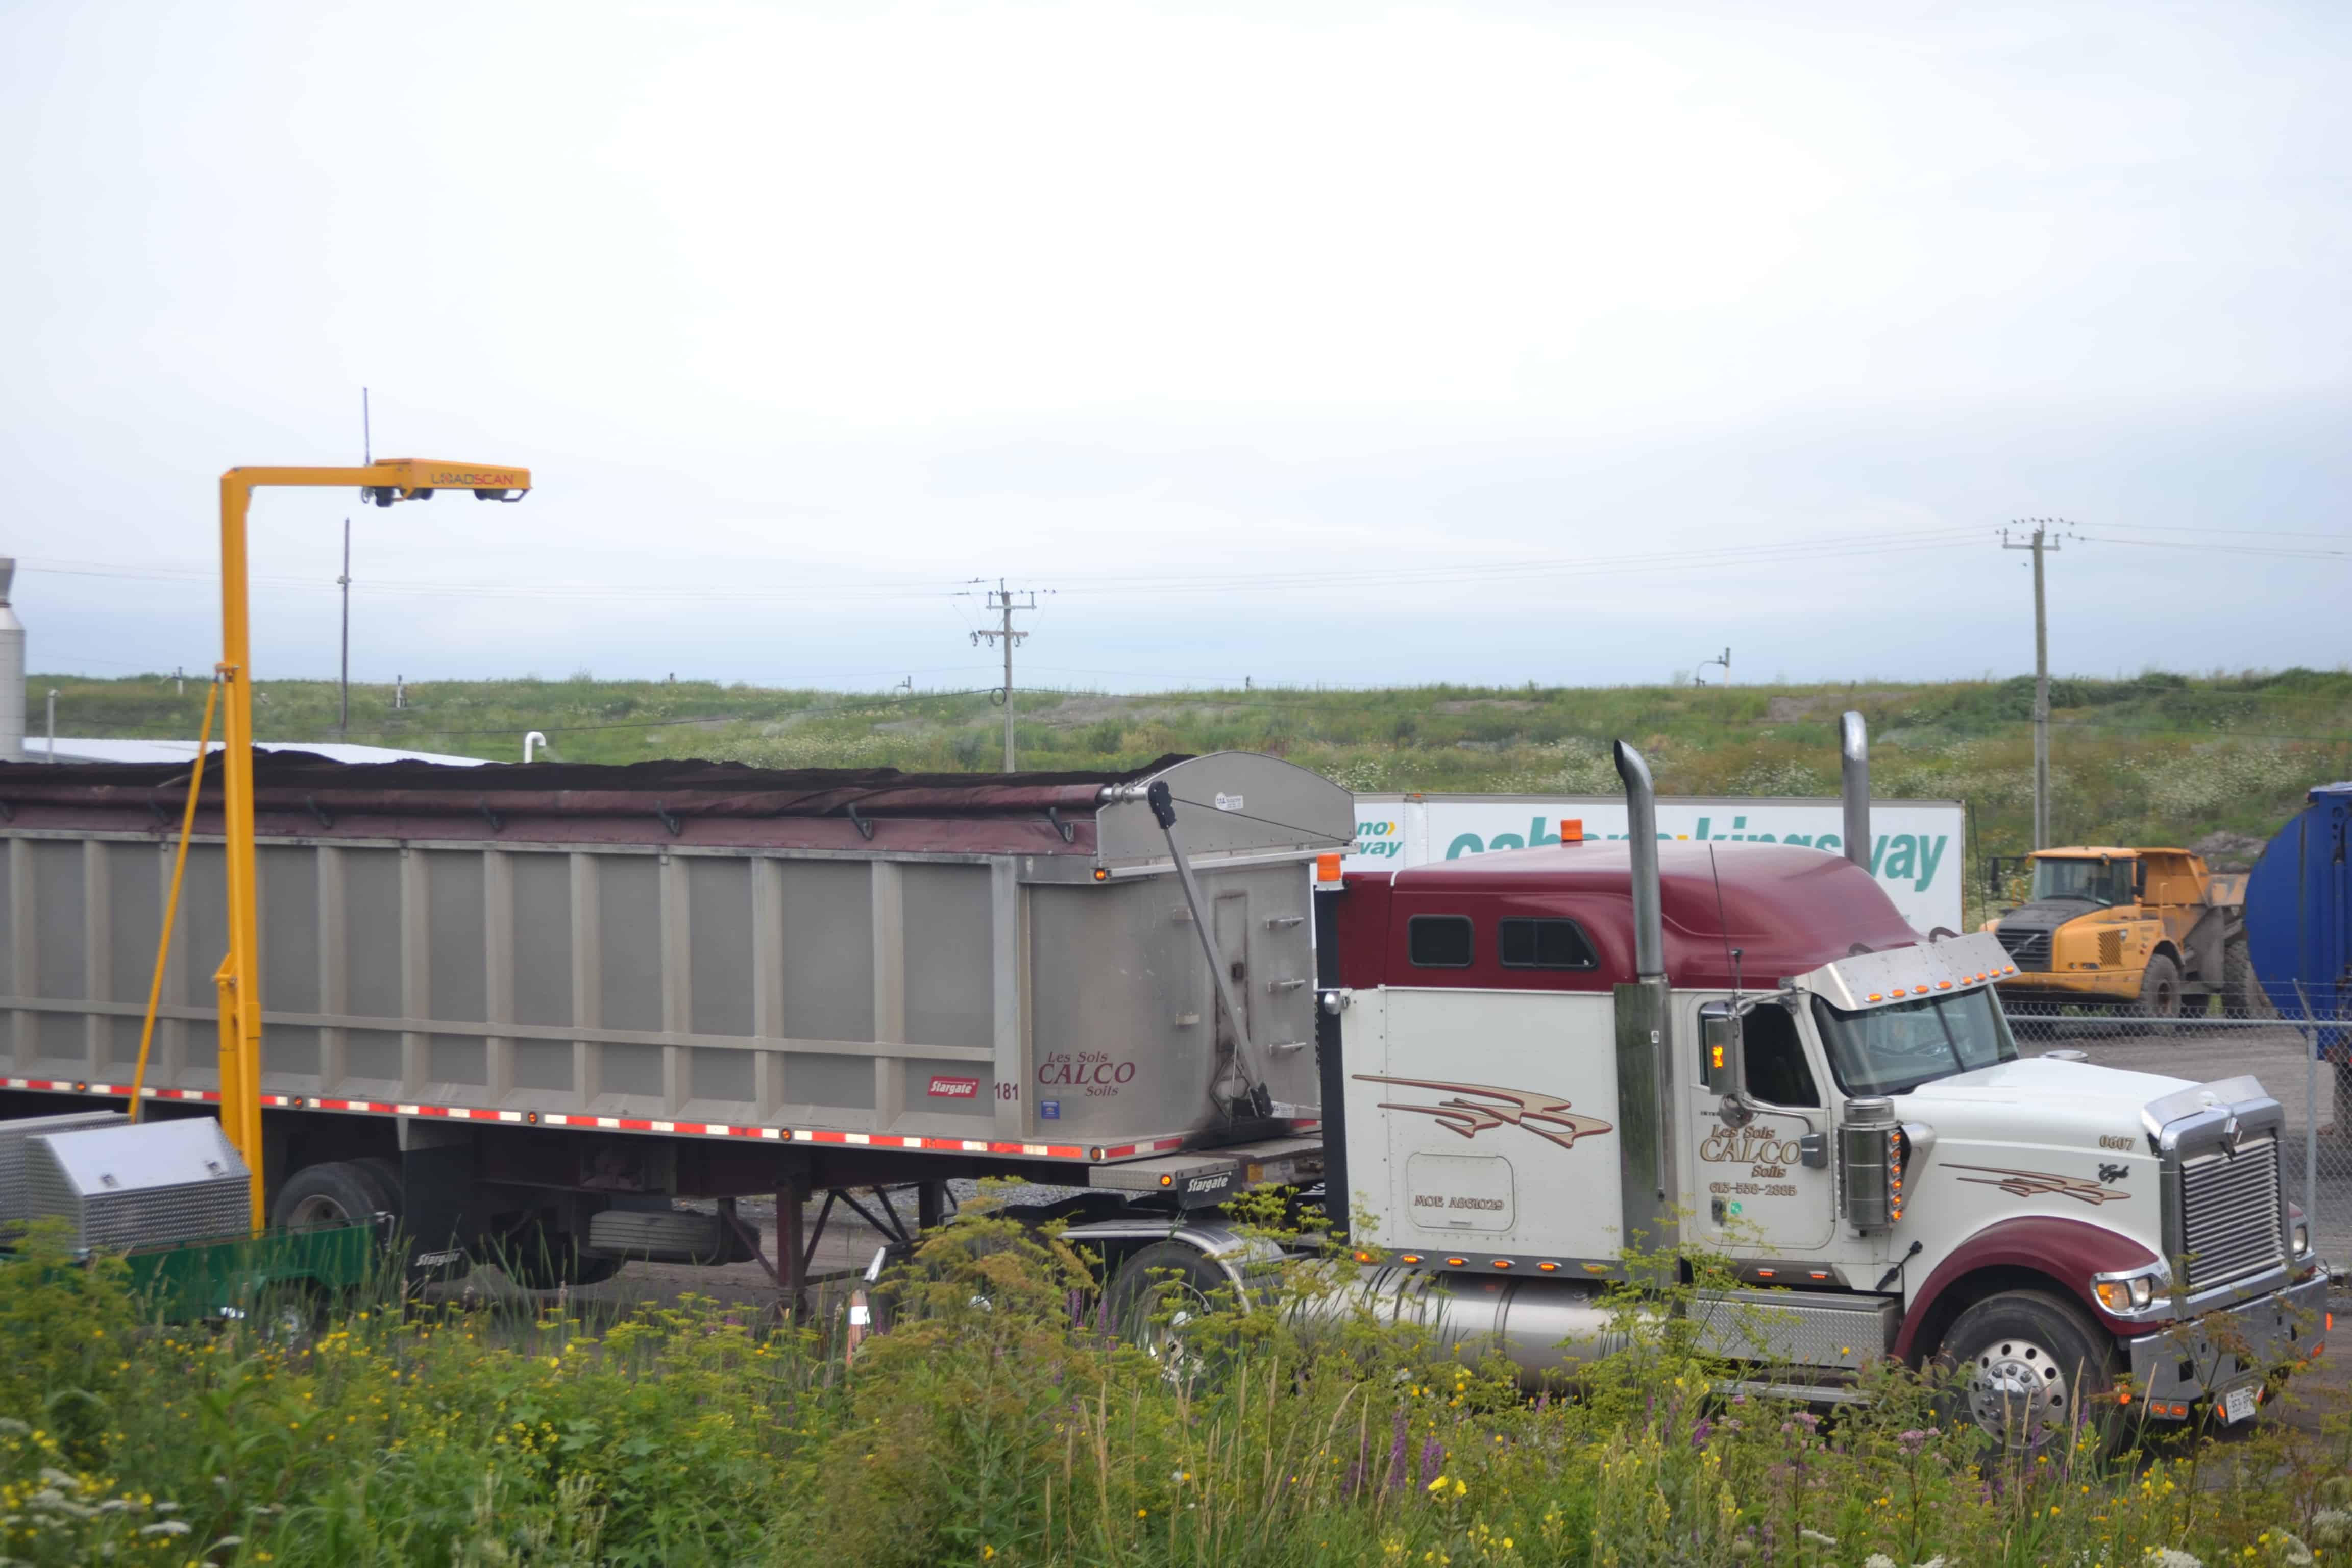
The civil construction industry is rapidly moving away from weight-based estimations in favor of non-contact volumetric scanning. By using elevated LiDAR laser scanners, the system scans empty truck beds to create a reference profile, then scans loaded trucks in-motion.
By comparing the 3D profiles, the software calculates the exact loose volume inside the truck bin with trade-certified ±1% accuracy, completely independent of moisture, density, or operator variation.
For Florida-based site development contractor The Kearney Companies, switching from “guessed” 18-yard supplier tickets to exact volumetric scanning revealed they were actually receiving an average of only 16.5 yards per load. This single operational correction saved them $250,000 per scanner, proving that when you sell or buy in volume, you must measure in volume.
Frequently Asked Questions
Loadscan systems have been independently tested and achieve industry-leading accuracy of +/–1%, even in harsh environments.
On-board scales can be wildly inaccurate without regular calibration, and bucket counting varies considerably from operator to operator. Volume scanning provides a consistent, automated, and objective measurement standard.
The LVS measures load volume in cubic metres or cubic yards, it does not directly measure weight. Weight can be estimated if the bulk density of the material is known.
Load volume scanning measures cubic volume rather than weight. Many sites use Loadscan scanners alongside weighbridges to cross-check payloads, manage density variations, and improve overall load control.
Vehicles drive beneath an elevated scan head, which uses LiDAR lasers to scan the truck bed or trailer and capture a volumetric measurement of the load. Some systems include an RFID tag reader to identify individual trucks and trailers, and load management software which records full details of each scan, including 3D load profiles. These scan profiles can also identify underloading, overloading, and off-centre loading which can